My Nextcloud instance feels… sluggish, for lack of better term. It’s working, but it definitely feels slow. Pages take seconds to load. Let’s continue our previous investigation of Nextcloud slowness and try to fix this.
I will warn you, not all investigations did lead to an optimization, most were dead ends. But I think the process is still valuable as I will show you interesting techniques. So it’s worth to read along.
If you had to take out one thing from this post, it should be know your whole system. As you’ll see, I dived deep into profiling which was helpful, but in the end what helped the most was a macro view of my server.
Finding Interesting Profiles
Last time, we enabled
debugging
in Nextcloud by having PHP write a profile for every request having the appropriate header. At the
time, we used curl to issue select requests to Nextcloud.
This time, we want to do it with a more realistic load through the browser by simply loading various pages and seeing what requests take a long time to run, then check their profiles.
For Firefox, I use the extension
BrianGilbert/xdebug-helper-for-firefox
which adds the required trigger header to outgoing requests. In the extension’s settings page we set
the “Trace Trigger Value” and “Profile Trigger Value” to debug me which must be the value we set
for the xdebug.trigger_value PHP option.
For reference, here are the PHP option we set in the previous blog post (in nix syntax):
services.nextcloud.phpOptions = {
  "xdebug.trigger_value" = "debug_me";

  "xdebug.mode" = "profile";
  "xdebug.output_dir" = "/var/log/xdebug";
  "xdebug.start_with_request" = "trigger";
};
A good candidate for interesting profiles is the Photos main page under /apps/photos/. We go to
that page then enable profiling in the extension by clicking on the little icon in the URL bar:

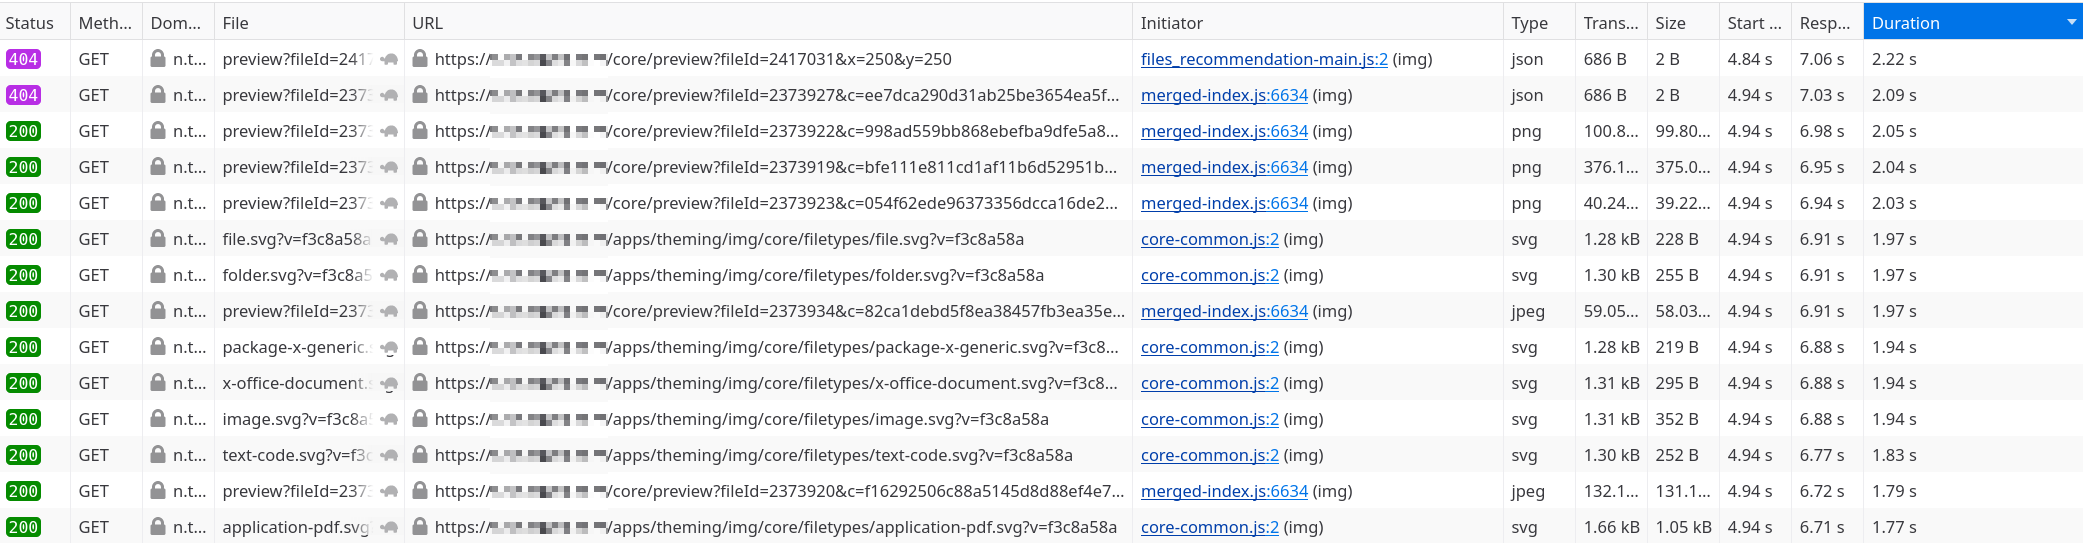
Now, we open the Web Developer Tools and go to the Network tab and reload the page. We can see all the requests being made. To pick an interesting one, we can simply sort by duration:
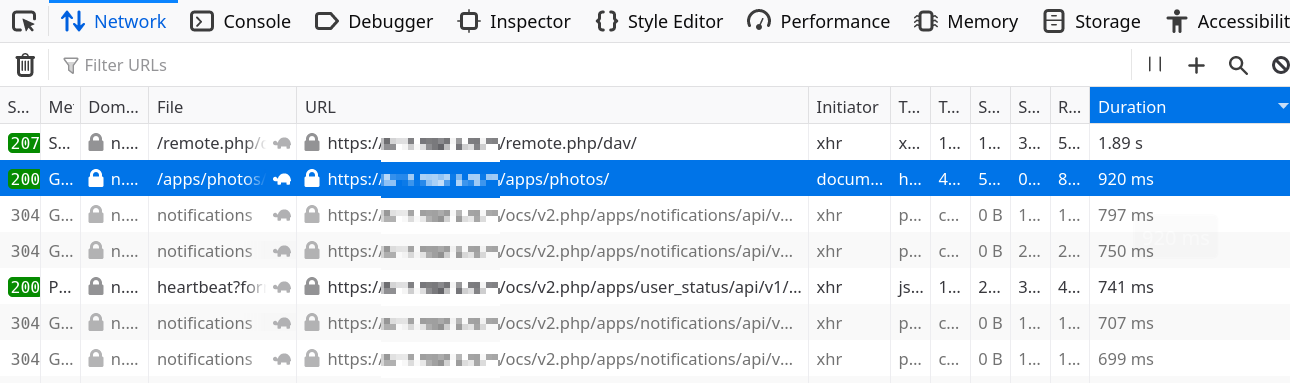
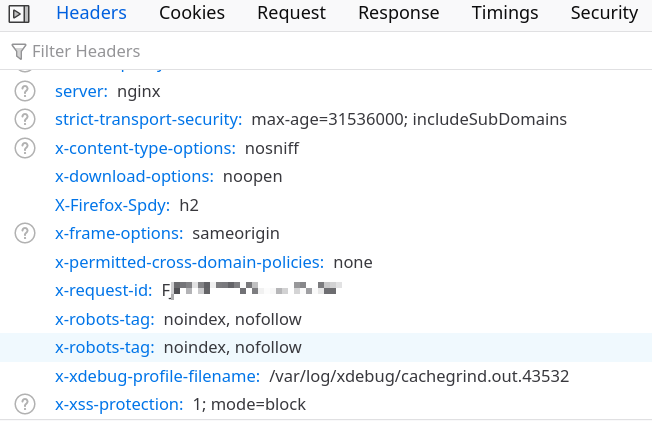
Ah! The main request to /apps/photos is second on the list, let’s start with that one. To know
what the corresponding profile is, we can just look at the x-xdebug-profile-filename response
header:
Finally, let’s download the profiles locally and open them with kachegrind:
rsync -va --delete myserver:/var/log/xdebug .Another request that was very slow - 12 seconds! - was accessing a folder through webdav:
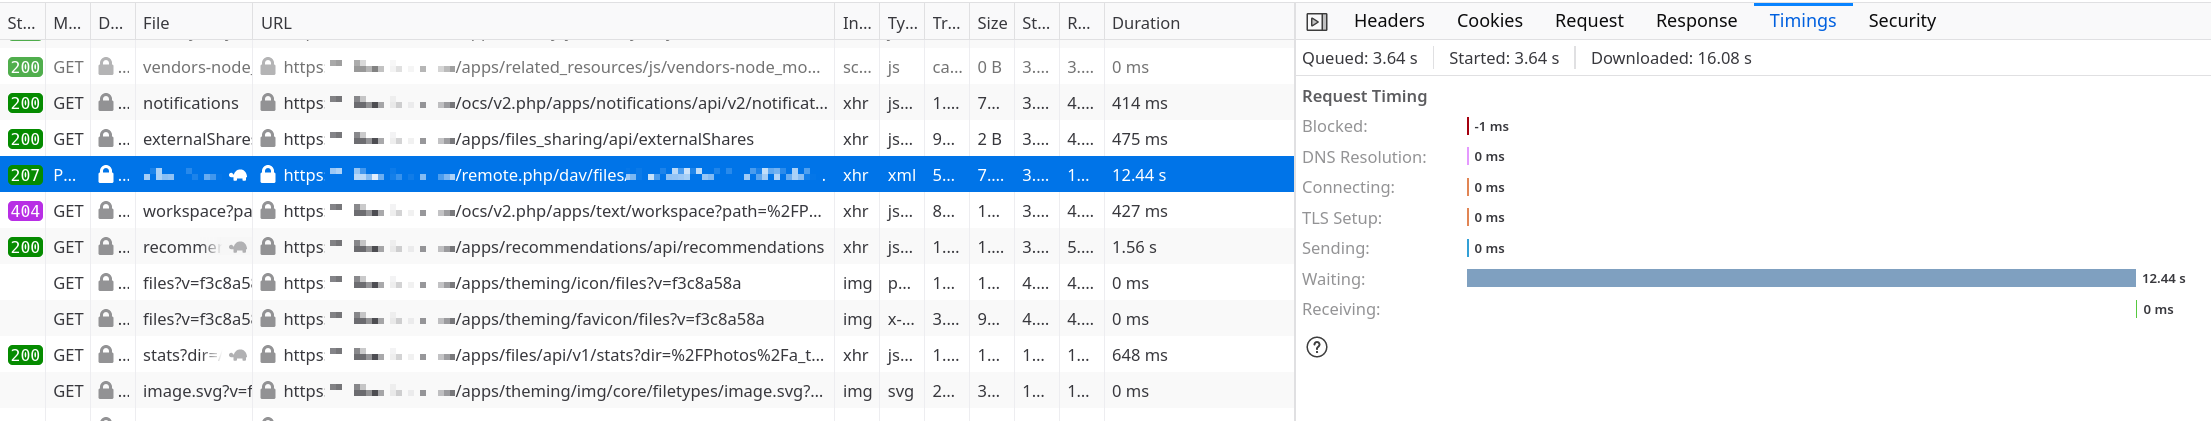
We will check the profile for that one later.
Analyzing the First Profile - It’s the Database!
Spoiler: result of this analysis is mixed.
Let’s analyze the profile with KCacheGrind:
nix run nixpkgs#kcachegrind xdebug/cachegrind.out.43532With KCacheGrind open, we can then sort all the function calls by the self parameter. This will show us where most of the time is spent.
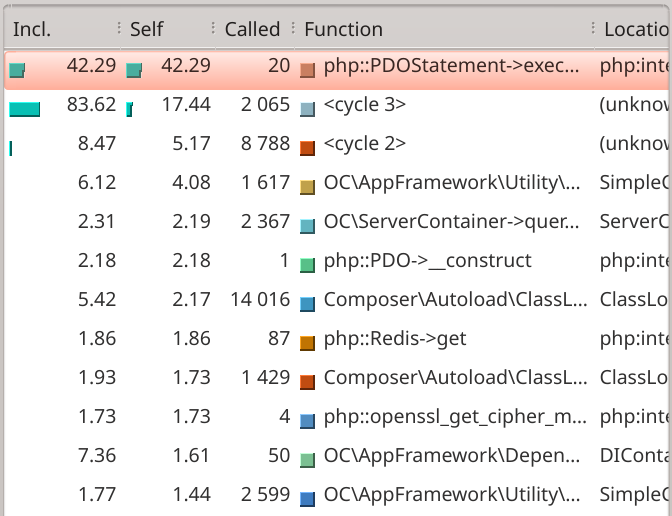
And we see the culprit: calls to the database. This line is very promising as it shows the query was I/O bound (because call to database) and it has all the attributes of something we can optimize:
- We have knobs to tune the database. Changing the Nextcloud code would’ve been harder.
- There are only 20 calls that take 42.29% of the time. We know from looking at the network tab in
the browser that the whole query took 920ms. So that’s
920ms * 42.29/100 / 20 calls = 19.45 ms per call.
I’m not sure if 20 ms per call is slow or not, but loading the page feels sluggish for sure so we’ll see if there’s anything we can do.
Diving Into the Database Call
There are several ways we can log slow queries. Here, we will print all queries that take longer
than one second by setting the log_min_duration parameter to 1000 (1 second).
There are also multiple ways to set this value. Here, I’ll do it through SQL:
$ sudo -u nextcloud psql
psql (14.10)
Type "help" for help.

UPDATE pg_settings
  SET setting = 1000
  WHERE name = 'log_min_duration_statement';
Now, after reloading a few times the page at /apps/photos, I see sometimes printed in the logs a
query fetching from the oc_filecache table (formatting mine):
[35320] LOG:  duration: 4894.961 ms execute <unnamed>:
  SELECT "file"."fileid", "storage",
    "path", "path_hash", "file"."parent", "file"."name",
    "mimetype", "mimepart", "size", "mtime",
    "storage_mtime", "encrypted", "etag", "permissions",
    "checksum", "unencrypted_size"
  FROM "oc_filecache" "file"
  WHERE (("file"."name" = $1) OR ("file"."name" = $2))
    AND (("storage" = $3)
    AND (("path" = $4) OR ("path" LIKE $5)))
[35320] DETAIL: parameters:
  $1 = '.nomedia',
  $2 = '.noimage',
  $3 = '5',
  $4 = 'files',
  $5 = 'files/%'
This is super useful because we can run an EXPLAIN ANALYZE on it. But before that, we will enable
track_io_timing which will print “time spent reading and writing data file blocks and temporary
file blocks (in milliseconds)”:
UPDATE pg_settings
  SET setting = 'on'
  WHERE name = 'track_io_timing';
Now, the explain:
nextcloud=> EXPLAIN (ANALYZE, BUFFERS)
  SELECT "file"."fileid", "storage",
    "path", "path_hash", "file"."parent", "file"."name",
    "mimetype", "mimepart", "size", "mtime",
    "storage_mtime", "encrypted", "etag", "permissions",
    "checksum", "unencrypted_size"
  FROM "oc_filecache" "file"
  WHERE (("file"."name" = '.nomedia')
         OR ("file"."name" = '.noimage'))
    AND (("storage" = 5)
    AND (("path" = 'files') OR ("path" LIKE 'files/%')));
Which outputs:
Gather  (cost=9808.72..112624.78 rows=7 width=211)
        (actual time=101.721..150.161 rows=5 loops=1)
  Workers Planned: 2
  Workers Launched: 2
  Buffers: shared hit=49589 dirtied=65
  ->  Parallel Bitmap Heap Scan on oc_filecache file
      (cost=8808.72..111624.08 rows=3 width=211)
      (actual time=94.107..125.883 rows=2 loops=3)
    Recheck Cond: (storage = 5)
    Filter: ((((name)::text = '.nomedia'::text) [...]
    Rows Removed by Filter: 193922
    Heap Blocks: exact=16025
    Buffers: shared hit=49589 dirtied=65
    ->  Bitmap Index Scan on fs_storage_mimepart
        (cost=0.00..8808.72 rows=580305 width=0)
        (actual time=30.398..30.398 rows=622607 loops=1)
      Index Cond: (storage = 5)
      Buffers: shared hit=1036
Planning:
  Buffers: shared hit=315
Planning Time: 1.686 ms
Execution Time: 150.286 ms
(17 rows)
The execution took this time only 150ms! It also uses indices as we would want. Was the slow request a fluke?
A Database Call That’s Slow
The storage parameter intrigued me though so I thought I’d peek into how many rows there are per
storage value:
nextcloud=> SELECT storage, COUNT(*)
            FROM oc_filecache
            GROUP BY storage;

 storage |  count
---------+---------
       1 |       4
       2 | 1604311
       5 |  583191
       6 |       4
       7 |    1071
       8 |       9
       9 |  149197
(7 rows)
Earlier, we ran the explain with WHERE storage=5. Let’s try storage=2 which has more rows:
Gather  (cost=1000.00..120228.77 rows=20 width=211)
        (actual time=4971.440..4995.646 rows=0 loops=1)
  Workers Planned: 2
  Workers Launched: 2
  Buffers: shared hit=49096 read=48279 dirtied=53
  I/O Timings: read=13205.555
  ->  Parallel Seq Scan on oc_filecache file
        (cost=0.00..119226.77 rows=8 width=211)
        (actual time=4962.747..4962.748 rows=0 loops=3)
    Filter: (((name)::text = '.nomedia'::text) [...]
    Rows Removed by Filter: 779248
    Buffers: shared hit=49096 read=48279 dirtied=53
    I/O Timings: read=13205.555
Planning:
  Buffers: shared hit=315
Planning Time: 3.013 ms
Execution Time: 4995.789 ms
(14 rows)
This time, the query took 5 seconds to run! It’s doing a sequential scan and clearly doing some disk I/O.
Usually, you’ll want to run a VACUUM on a table to make sure PostgresSQL can optimize the plan:
nextcloud=> VACUUM ANALYZE oc_filecache;
VACUUM
That didn’t change the explain significantly.
By the way, we’re printing the BUFFERS values because that will show us all buffer and I/O
timings. From the documentation:
Include the number of shared blocks hit, read, dirtied, and written, the number of local blocks hit, read, dirtied, and written, the number of temp blocks read and written, and the time spent reading and writing data file blocks and temporary file blocks (in milliseconds) if track_io_timing is enabled. (we did enable it!)
A hit means that a read was avoided because the block was found already in cache when needed. Shared blocks contain data from regular tables and indexes; local blocks contain data from temporary tables and indexes; while temporary blocks contain short-term working data used in sorts, hashes, Materialize plan nodes, and similar cases.
The fast query from above, the one hitting storage 5, has only hits! No wonder it’s fast. On the other hand, the slow one hitting storage 2 has a lot of reads.
The number of blocks dirtied indicates the number of previously unmodified blocks that were changed by this query; while the number of blocks written indicates the number of previously-dirtied blocks evicted from cache by this backend during query processing.
There’s not a significant difference in the dirtied buffers between both slow and fast queries, so we won’t be looking too much into that. Let’s instead see how to reduce shared buffer reads.
An Insight About Caching
To make sure the explain plan wasn’t a fluke, I ran it a few times in a row to try to load the
results in the cache. That actually made an impact. At one point, the query with storage = 2
managed to run in 300ms, instead of the 5 seconds we saw earlier. What changed wasn’t the shared
buffers read value but the I/O timing! I suppose this means the OS itself or the disk was caching
the results but I don’t know how to confirm this. Let’s try to tune the shared buffers to improve
caching.
A few things to note before we continue. The drive where the PostgreSQL database is located is an NVMe drive. This is pretty fast already.
$ df /var/lib/postgresql
Filesystem                                             1K-blocks     Used Available Use% Mounted on
/dev/disk/by-uuid/6da26333-4d11-4b29-9509-6dcc8151013b 114304164 51399260  57052388  48% /

$ readlink /dev/disk/by-uuid/6da26333-4d11-4b29-9509-6dcc8151013b
../../sda1

$ sudo fdisk -l /dev/sda
Disk /dev/sda: 119.24 GiB, 128035676160 bytes, 250069680 sectors
Disk model: SK hynix SC311 S
Not the fastest NVMe hard drive but it will have to do.
The other thing to note is the results do not stay in the cache very long. If I wait even just 10 seconds and re-issue the explain, the query already takes more than a second again from the 300ms. I got the feeling optimizing this is going to be tricky.
I found the following website that allows you to input your PostgreSQL machine specs and outputs what settings you should set. https://pgtune.leopard.in.ua/. My server’s spec are:
- Intel(R) Core(TM) i5-6600T CPU @ 2.70GHz (2 core with hyper-threading, so 4 in total)
- 7 GB + 512 MB memory
But since I know this server is shared by quite a few services, I only allotted 2Gb of memory and 1 CPU core. Specifically, I inputted:
DB Version = 14
OS Type = "linux"
DB Type = "web"
Total Memory (RAM) = "2 GB"
CPUs num = 1
Connections num = 100
Data Storage = "sdd"
I used the web application (web) profile as the description matched the most.
This gave me:
max_connections = "100";
shared_buffers = "512MB";
effective_cache_size = "1536MB";
maintenance_work_mem = "128MB";
checkpoint_completion_target = "0.9";
wal_buffers = "16MB";
default_statistics_target = "100";
random_page_cost = "1.1";
effective_io_concurrency = "200";
work_mem = "2621kB";
huge_pages = "off";
min_wal_size = "1GB";
max_wal_size = "4GB";
That didn’t change how long the query stays cached. But that’s when I found the extension pg_prewarm. This allows you to manually cache a whole table into RAM!
Let’s try it out:
nextcloud=> SELECT pg_prewarm('oc_filecache');
 pg_prewarm
------------
      97375
(1 row)
Seq Scan on oc_filecache file (cost=0.00..138449.77 rows=423562 width=211) (actual time=372.843..372.844 rows=0 loops=1)
Filter: ((storage = 2) AND (((path)::text = 'files'::text) OR ((path)::text ~~ 'files/%'::text)))
Rows Removed by Filter: 2338703
Buffers: shared hit=97375
Planning Time: 0.286 ms
Execution Time: 372.879 ms
(6 rows)Very promising although I’m reluctant to have this table be forced into memory by a cron job running
pg_prewarm. It feels heavy handed and there’s probably a reason why Postgres doesn’t provide a way
to do this out of the box. Are there any knobs I could tweak though? I’m not sure how to progress
here to be honest.
Statistical Analysis
The query above is just one query though. Is continuing to investigate this query even worth it? To
be sure, let’s enable the pg_stats_statement extension with:
nextcloud=> CREATE EXTENSION pg_stats_statement;We can then issue the following query that is inspired by this blog post. I made the it so
only the query’s verb (SELECT, INSERT, …) and table name are shown. Also, I order by
mean_exec_time.
SELECT
  regexp_replace(
    regexp_replace(
      query,
      '^([^ ]+).*FROM ([^ ]+).*',
      '\1 \2'
    ),
    '(UPDATE|INSERT INTO) ([^ ]+).*$',
    '\1 \2'
  ) AS short_query,
  round(total_exec_time::numeric, 2) AS total_exec_time,
  calls,
  round(mean_exec_time::numeric, 2) AS mean,
  round((100 * total_exec_time /
  sum(total_exec_time::numeric) OVER ())::numeric, 2) AS percentage_cpu
from pg_stat_statements
WHERE query NOT LIKE '%ANALYZE%'
  AND query NOT LIKE '%EXPLAIN%'
  AND query NOT LIKE '%pg_stat_statements%'
ORDER BY mean DESC
LIMIT 20;
Before running the above query, I created the extension and used Nextcloud for about a week.
Times are in milliseconds. This clearly tells me that indeed this table’s worth optimizing for as it’s taking most of the places in the top 20:
             short_query              | total_exec_time | calls |  mean   | percentage_cpu
--------------------------------------+-----------------+-------+---------+----------------
 SELECT "oc_filecache"                |      1782003.82 |   296 | 6020.28 |          36.60
 SELECT "oc_filecache"                |         4758.20 |     2 | 2379.10 |           0.10
 <insufficient privilege>             |         4297.53 |     3 | 1432.51 |           0.09
 SELECT "oc_filecache"                |        13057.10 |    10 | 1305.71 |           0.27
 SELECT oc_filecache                  |         1171.26 |     1 | 1171.26 |           0.02
 SELECT "oc_filecache"                |         2088.51 |     2 | 1044.25 |           0.04
 SELECT "oc_filecache"                |        21261.02 |    24 |  885.88 |           0.44
 SELECT "oc_filecache"                |         1905.76 |     4 |  476.44 |           0.04
 <insufficient privilege>             |          458.04 |     1 |  458.04 |           0.01
 SELECT "oc_filecache"                |         5969.22 |    14 |  426.37 |           0.12
 SELECT "oc_systemtag_object_mapping" |       131973.41 |   316 |  417.64 |           2.71
 SELECT oc_filecache                  |         1035.19 |     3 |  345.06 |           0.02
 DELETE "oc_activity"                 |         4890.14 |    16 |  305.63 |           0.10
 SELECT "oc_filecache"                |         1345.88 |     5 |  269.18 |           0.03
 UPDATE "oc_filecache"                |       361959.17 |  1739 |  208.14 |           7.43
 SELECT "oc_file_metadata"            |          130.37 |     1 |  130.37 |           0.00
 SELECT "oc_file_metadata"            |          122.03 |     1 |  122.03 |           0.00
 SELECT "oc_activity"                 |       123446.91 |  1247 |   99.00 |           2.54
 <insufficient privilege>             |          187.31 |     2 |   93.65 |           0.00
 <insufficient privilege>             |          175.60 |     2 |   87.80 |           0.00
But to be honest, I don’t know how to continue here. If anyone reading this has an idea, feel free to contact me :D
Let’s switch to another request, maybe there’s one that I can actually optimize.
A Profile That’s Harder to Optimize
This is an example of request that’s harder to optimize. Indeed, it is CPU bound as we can see because most of the time is spent cycling (in a loop):
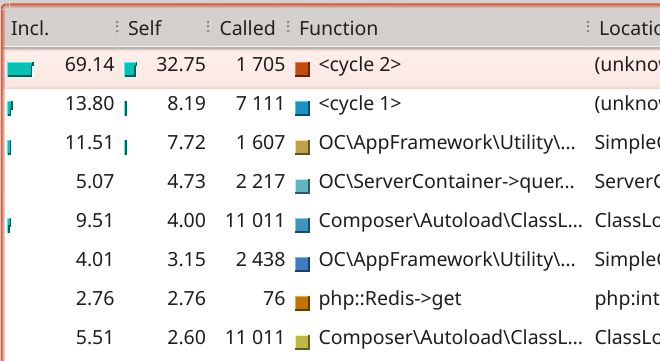
We’ll skip investigating this one as reducing the time this one takes likely means modifying Nextcloud code or from one of its dependencies.
Analyzing a Second Interesting Profile
To find another one, I just clicked in the UI until I got a request that took longer than 5 seconds.
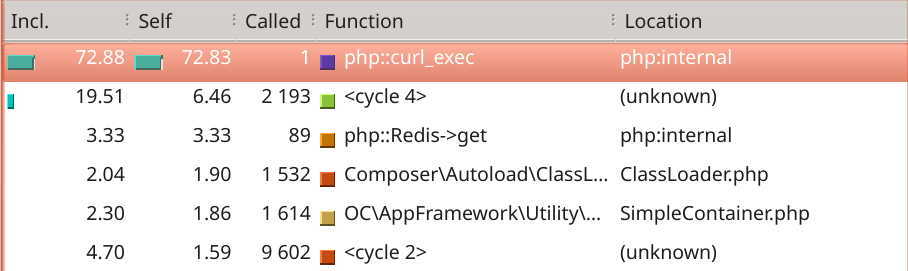
Unfortunately, I found one. 12 seconds! That’s a good candidate for optimization.
The profile doesn’t show much, just that PHP is doing some curl request, so we’ll need to look at the callers:
The caller stack is fully linear which is great news because there’s no loop involved at all.
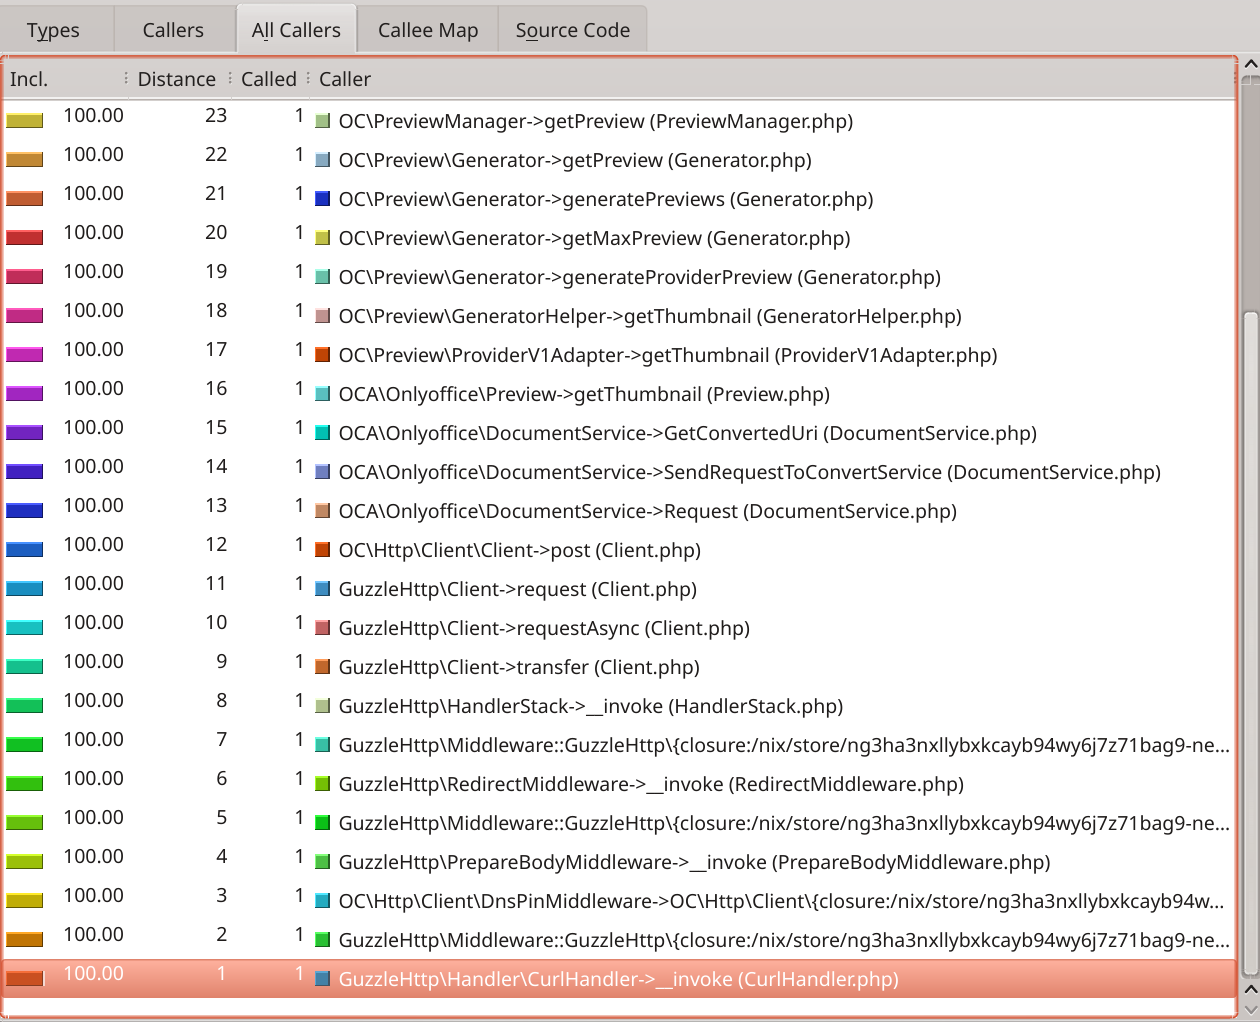
We can see Nextcloud is asking for the preview of a file which gets forwarded to the OnlyOffice plugin which in turns makes an HTTP call to presumably the OnlyOffice service running on my server.
Or is it? Actually, the third to last caller is DnsPinMiddleware from lines 109-155 (lines elided
in the screenshot). The related code can be seen on GitHub. This is clearly some DNS resolving
code. I know I already mis-configured some things here so let’s review my configuration and see if
we can spot some mistakes.
Analyzing DNS Config
I did set up the integration in Nextcloud to access my OnlyOffice service at onlyoffice.mydomain.com:
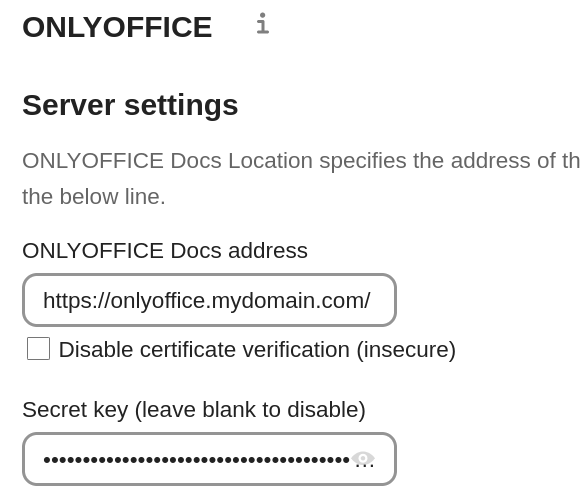
My OnlyOffice server is accessible at onlyoffice.mydomain.com (it’s not really mydomain.com of
course). Let’s try a dig (I obfuscated the actual IP address and domain name):
$ nix run nixpkgs#dig onlyoffice.mydomain.com

; <<>> DiG 9.18.20 <<>> onlyoffice.mydomain.com
;; global options: +cmd
;; Got answer:
;; ->>HEADER<<- opcode: QUERY, status: NOERROR, id: 7924
;; flags: qr rd ra; QUERY: 1, ANSWER: 1, AUTHORITY: 0, ADDITIONAL: 1

;; OPT PSEUDOSECTION:
; EDNS: version: 0, flags:; udp: 4096
;; QUESTION SECTION:
;onlyoffice.mydomain.com.        IN  A

;; ANSWER SECTION:
onlyoffice.mydomain.com.  19778  IN  A  WWW.XXX.YYY.ZZZ

;; Query time: 0 msec
;; SERVER: 192.168.1.60#53(192.168.1.60) (UDP)
;; WHEN: Thu Dec 14 06:01:53 UTC 2023
;; MSG SIZE  rcvd: 60
I have my own dnsmasq server listening at 192.168.1.60 and who answered us:
;; SERVER: 192.168.1.60#53(192.168.1.60) (UDP)It told us that the onlyoffice.mydomain.com address can be found at my public IP (obfuscated here
for reasons).
onlyoffice.mydomain.com. 19778 IN A WWW.XXX.YYY.ZZZThis is clearly not a good thing because it means my DNS server is answering with the public IP of my router. It should instead answer with the private IP of my server.
This has two main implications. Firstly, it means my DNS server doesn’t know this
onlyoffice.mydomain.com fqdn and forwards the question to a public DNS. This is bad for
performance reasons but also for privacy reasons as it’s leaking DNS calls that should be internal
only. Also, this won’t work if my internet is disconnected.
Secondly, the subsequent HTTP call (which we didn’t see in the profile) will try to contact my OnlyOffice service using my public IP address instead of the private IP directly. This means at least more hops and so an increased response time. Actually, the router is smart and realizes the IP I want to reach is its own public IP so the request won’t actually go out to the internet thanks to NAT hairpinning. Here it’s helping us a bit but it bit me previously.
Anyway, the correct fix here is to make my dnsmasq service aware of OnlyOffice and answer to the
DNS queries with the internal IP of my server which is 192.168.1.10:
services.dnsmasq.settings.address = [
  "/onlyoffice.mydomain.com/192.168.1.10"
];
This is the resulting change in the dnsmasq config file:
address=/onlyoffice.mydomain.com/192.168.1.10After deploying this, dig returns the internal IP:
$ nix run nixpkgs#dig onlyoffice.mydomain.com

; <<>> DiG 9.18.20 <<>> onlyoffice.mydomain.com
;; global options: +cmd
;; Got answer:
;; ->>HEADER<<- opcode: QUERY, status: NOERROR, id: 45810
;; flags: qr aa rd ra; QUERY: 1, ANSWER: 1, AUTHORITY: 0, ADDITIONAL: 1

;; OPT PSEUDOSECTION:
; EDNS: version: 0, flags:; udp: 4096
;; QUESTION SECTION:
;onlyoffice.mydomain.com.     IN  A

;; ANSWER SECTION:
onlyoffice.mydomain.com.   0  IN  A  192.168.1.10

;; Query time: 0 msec
;; SERVER: 192.168.1.60#53(192.168.1.60) (UDP)
;; WHEN: Sat Dec 16 17:59:15 UTC 2023
;; MSG SIZE  rcvd: 60
Great, with that fixed, let’s reload the UI and look at remaining long running requests.
Remaining Optimizations
I’m just reloading the /apps/files/?dir=/ endpoint and there are quite a few indeed:
I see files, files, files. I bet this oc_filecache table has something to do with all these.
Actually, no! It’s Redis, another dependency of Nextcloud used for caching.
All the profiles have one thing in common, they spend a lot of time calling to Redis. Sometimes 30% of the time as can be seen in the following table which I compiled from 4 profiles:
| Time (ms) | # Calls | Per Call (ms) | % of Request |
|---|---|---|---|
| 286 | 89 | 3.2 | 30.4 |
| 273 | 86 | 3.2 | 13.7 |
| 529 | 89 | 5.9 | 25 |
| 486 | 86 | 5.7 | 24.3 |
3 milliseconds per call is not much, but it adds up.
The documentation gives us a good hint as to why Redis could be slow, it could be Redis swapping to disk. To check that, we can issue the following command:
$ sudo -u nextcloud redis-cli -s /run/redis-nextcloud/redis.sock info | grep process_id
process_id:1424342

$ cd /proc/1424342

$ sudo cat smaps | egrep '^(Swap|Size)'
[...]
Size:   364 kB
Swap:   364 kB
Size:   8192 kB
Swap:   1296 kB
Size:   24576 kB
Swap:   19004 kB
Indeed, a few memory maps are pretty heavily swapped. Not good, I suppose?
That made me think, could this be the case also for PostgreSQL? I issued the same commands as above,
using systemctl cat postgresql to get the PID. And Indeed, that was the case.
I don’t have a permanent fix against swapping but I could already test if swapping has an impact
simply by restarting Redis and PostgreSQL. I did that, re-ran the smaps command above, verified
nothing was swapped and reloaded the web UI. But that didn’t help, the request was still spending
the same amount of time on Redis calls and PostgreSQL calls.
Return to the Basics
After this very disappointing optimization tour, I thought maybe I should check the overall pressure on the system.
$ free -m
      total  used  free   shared  buff/cache  available
Mem:   7663  5328   209      334        2125       1703
Swap:  7628  7271   357
There’s 1.7Gb of available memory, so that’s good, not all RAM is used. But 7.2Gb of SWAP is used! That’s really not good.
Oh well, time to understand why so much SWAP is used. I found this script in the comments of a StackOverflow answer which prints the base command followed by the PID and the used SWAP space.
$ for file in /proc/*/status ; do \
    awk '/Tgid|VmSwap|Name/{printf $2 " " $3}END{ print ""}' $file; \
  done \
  | grep kB \
  | sort -k 3 -n \
  | tail -n 20
.php-fpm-wrappe 2608 50092 kB
.php-fpm-wrappe 2626 55092 kB
hledger-web 945 65476 kB
dotnet 1140 69844 kB
piper 2203 81592 kB
piper 2212 81600 kB
.php-fpm-wrappe 2515 102124 kB
.php-fpm-wrappe 2344 102152 kB
.php-fpm-wrappe 2463 103080 kB
.php-fpm-wrappe 2577 103212 kB
.php-fpm-wrappe 3559 103900 kB
.php-fpm-wrappe 2359 104004 kB
mono 1155 117608 kB
dotnet 1200 126696 kB
python3.11 1681 149296 kB
.wyoming-openwa 2086 155984 kB
.hass-wrapped 2141 239184 kB
jellyfin 33101 266688 kB
.wyoming-faster 2085 808604 kB
.wyoming-faster 2083 808608 kB
Wow there’s a lot. There’s no silver bullet to fix this but I will in the meantime stop the Home Assistant voice pipeline (wyoming/piper) and see how free swap looks like.
After about one hour of waiting, the used SWAP did decrease a bit:
$ free -m
      total  used  free   shared  buff/cache  available
Mem:   7663  4837   132      332        2693       2196
Swap:  7628  6030   159
After a couple days, free SWAP is at 785.
I think there’s no secret anymore. I need more RAM :’(